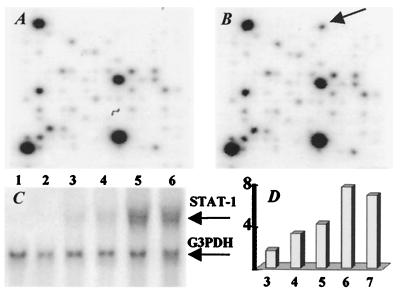
Figure 2.
Enhanced expression of STAT-1 in mouse brain after RV infection. CLONTECH Atlas Mouse 1.2 Expression Array filters were hybridized with 32P-labeled cDNA probes generated from normal brain RNA (A) and RNA from CVS-N2c infected brain at 6 days p.i. (B). The arrow in B indicates the position of STAT-1 on membrane that was up-regulated in this study. (C) STAT-1 mRNA expression levels were measured by Northern analysis in brain RNAs from uninfected (lane 1) or infected 3, 4, 5, 6, and 7 days previously (lanes 2–6). (D) Histogram shows the quantification of Northern blot signals. The expression ratios of STAT-1 relative to control sample (y axis) at 3, 4, 5, 6, and 7 days p.i. (x axis) indicate a higher expression level of STAT-1 gene at day 6 p.i.

