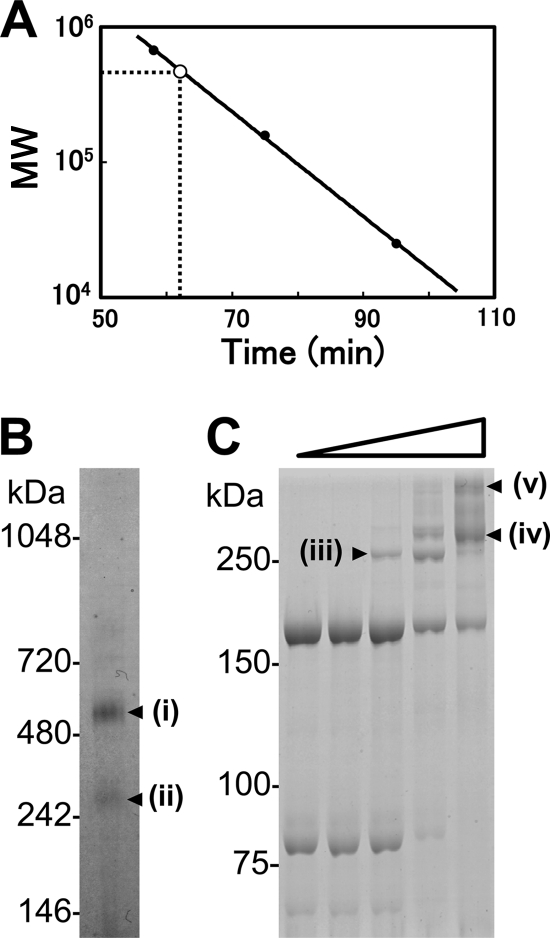
FIG. 2.
Size and composition of isolated P1-P90 complex. (A) Size estimation by gel filtration. The retention time and apparent molecular mass during gel filtration are presented on the x and y axes, respectively. The solid circles show size standards: thyroglobulin, 670 kDa; aldolase, 158 kDa; and chymotrypsinogen, 25 kDa. The open circle shows the position of the P1-P90 complex. (B) Protein profiles of the P1-P90 complex analyzed by BN-PAGE. Molecular masses are indicated on the left. (C) Protein profiles of the P1-P90 complex cross-linked by various concentrations of BS3 as represented by the open triangle. The protein fraction was treated with 0, 0.002, 0.02, 0.2, and 2 mM BS3 and subjected to SDS-6.0% PAGE. Molecular masses are indicated on the left. The protein bands marked i to v were analyzed by PMF.

