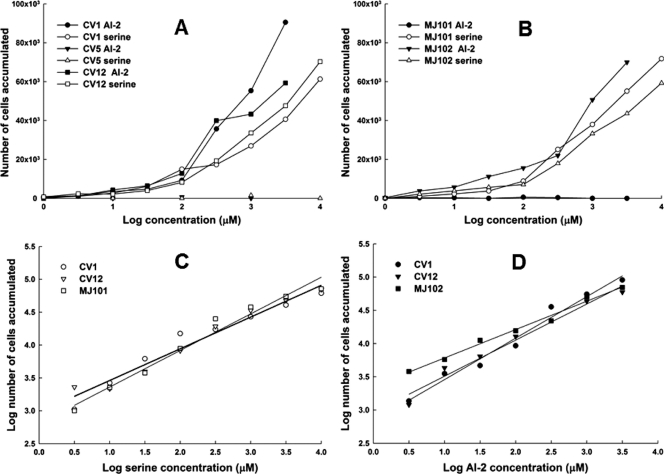
FIG. 2.
Responses of cells to l-serine and AI-2 in the capillary assay. Assays were performed at 32°C, essentially as described by Adler (1). Cells were resuspended in CB to a cell density of about 5 × 10⁷/ml. Assays were run twice, with three capillaries per run for each strain under each condition. Data shown are averages of six capillaries, and the standard deviations (not shown for purposes of clarity) ranged from 10 to 20%. The background accumulations in buffer-only capillaries were in the range of 500 to 1,000 cells. (A) Normalized values (with buffer-only control subtracted) of CV1 (wild-type) cells, CV5 (Δtsr) cells, and CV12 (Δtar-tap Δtrg) cells exposed to capillaries containing l-serine or AI-2. (B) Normalized values of MJ101 (lsrBΩKanr) cells and MJ102 (lsrCΩKanr) cells exposed to capillaries containing l-serine or AI-2. (C) Data for the responses of CV1, CV12, and MJ101 cells to l-serine, plotted on a log-log scale. The straight lines are linear regressions that can be extrapolated back to a threshold value. The extrapolated threshold concentrations, as predicted by Weber's law, are 1.7 × 10⁻¹² M for strain CV12 and 3.5 × 10⁻¹² M for strains CV1 and MJ101. The regression lines for CV12 and MJ101 were identical. (D) Data for the responses of CV1, CV12, and MJ102 cells to AI-2, plotted on a log-log scale. The linear regressions can be extrapolated back to a threshold value. The extrapolated threshold concentrations are 1.6 × 10⁻¹¹ for strain CV1, 4.6 × 10⁻¹² M for strain CV12, and 2.5 × 10⁻¹⁴ M for strain MJ102.

