FIG. 3.
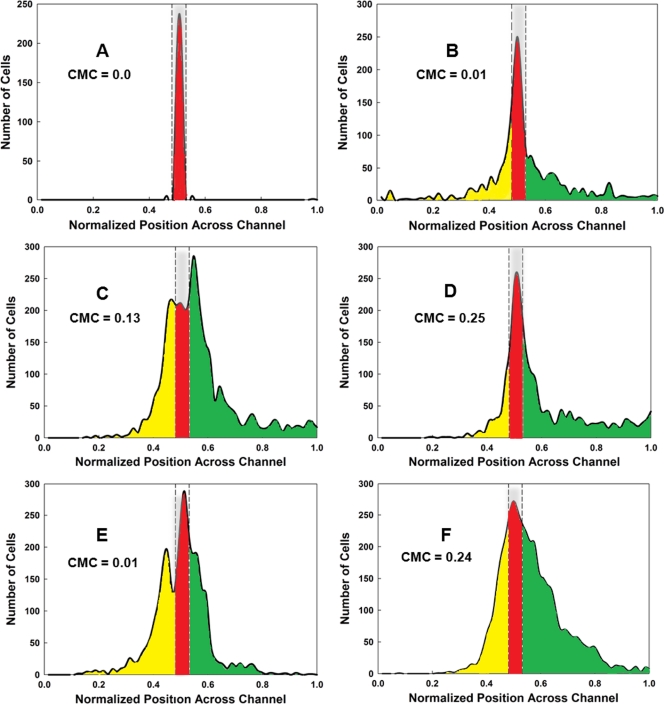
Assays of chemotactic behavior in the μFlow device. Cells were grown and prepared as for the μPlug assay, as described previously (9). The CMC was calculated according to the methods described in the text and elsewhere (10, 18). (A) Typical distribution of RFP-labeled dead cells, shown in red. The distribution of cells from one run is shown; it is typical for that found for RFP-labeled dead cells in all runs. The area occupied by dead cells is delineated by the gray bar enclosed in dashed lines. (B) Typical distribution of CV1 (wild-type) GFP-labeled cells in the absence of a chemoeffector gradient. The distribution of cells moving in the up-gradient direction beyond the “dead” zone is highlighted in green, and the distribution of cells moving in the down-gradient direction is highlighted in yellow. GFP-labeled cells remaining in the region occupied by dead cells (highlighted in red) were not included in the calculations of CMC values. (C) Typical distribution of CV1 cells in a 0-to-200 μM nonlinear gradient of l-serine. (D) Typical distribution of CV1 cells in a 0-to-200 μM nonlinear gradient of AI-2. (E) Typical distribution of CV1 cells in a 0-to-200 μM linear gradient of l-serine. (F) Typical distribution of CV1 cells in a 0-to-200 μM linear gradient of l-serine. All assays were run a minimum of three times. The CMC values obtained are indicated on each graph.

