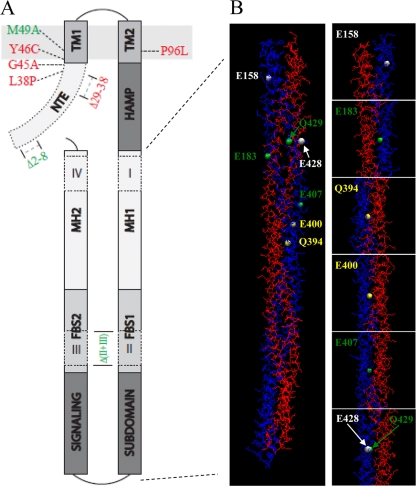
FIG. 6.
(A) Predicted topology of DifA and the effect of selected mutations on EPS production. The N-terminal extension (NTE) is cytoplasmic. It is followed by two transmembrane helices, TM1 and TM2, which are separated by nine residues in the periplasm. The HAMP domain connects TM2 to the C-terminal signaling domain, which forms a coiled-coil hairpin with three subdomains: the signaling subdomain, flexible bundle subdomain (FBS1 and FBS2), and the methylation helices (MH1 and MH2). Indels I and IV are in the MHs, whereas II and III are in the FBSs. Also indicated in the drawing are the positions of selected mutations and their effects on EPS production. Only mutations with minimum impact on DifA protein level are shown, and those in green led to increased EPS production, while those in red resulted in reduced or undetectable EPS levels. (B) The modeled structure of a DifAC dimer and the position of seven mutated E/Q residues in Fig. 5. The DifAC dimer is shown on the left. The two chains of the dimer are labeled blue (chain A) and red (chain B), respectively. The positions of the mutated E/Q residues in chain A are shown as white, green, or yellow spheres, corresponding to their mutations with either no phenotype, reduced EPS level only, or both increased and decreased EPS levels, respectively (see text). For a clearer illustration of the dimer interface, the panels on the right show the zoomed-in view of residues that were mutated. The same E/Q residues in chain B of the dimer are located in similar positions to those in chain A, although they are not in perfect symmetry.

