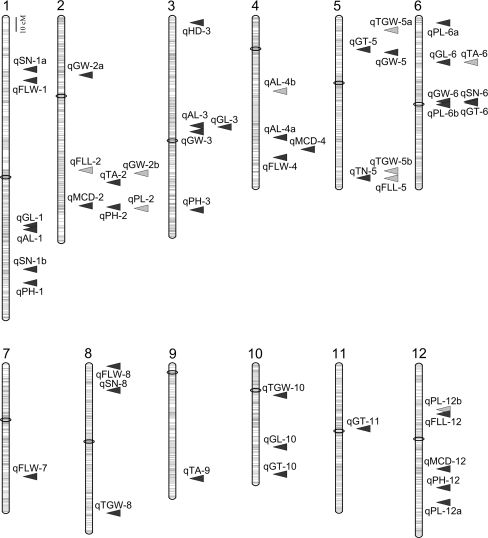
Fig. 4.
Chromosomal locations of detected QTL. Twelve rice chromosomes are numbered, with centromeres indicated by open circles. Positions of 2,334 bins used as genetic markers are indicated by horizontal lines spaced proportionally according to their genetic distance on the linkage map. Arrow heads indicate LOD peak locations of QTL. Black arrow heads QTL with LOD values above the threshold determined by permutation tests; gray arrow heads QTL with LOD values above 3.0 but below the permutation threshold. For QTL abbreviations, see Table 1

