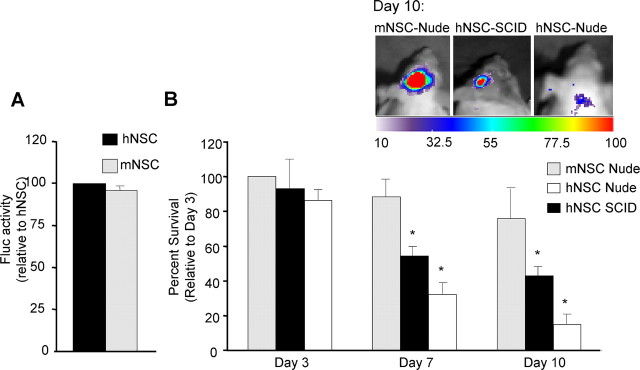
Figure 4.
Bioluminescence imaging of NSCs in mice brains. A, hNSCs or mNSCs transduced with LV-GFP-Fluc were plated and 24 h later imaged for bioluminescence. The photon intensities from mNSCs and hNSCs expressing GFP-Fluc are plotted as percentage relative to hNSCs. B, hNSCs or mNSCs expressing GFP-Fluc were implanted intraparenchymally in nude and SCID mice and followed by Fluc bioluminescence imaging on day 3, 7, and 10 d of implantation. One representative image of each mice group on day 10 is shown. The photon intensities from mNSCs and hNSCs expressing GFP-Fluc are plotted as percentage survival relative to mNSCs in nude mice at 3 d (*p < 0.05 vs mNSCs nude).

