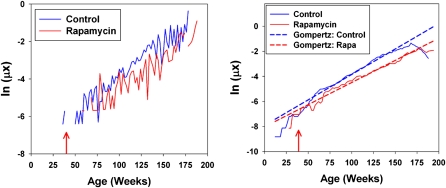
Figure 3.
Raw (left) and smoothed (right) plots of the logarithm of the mortality risk for control and rapamycin-treated mice as a function of age. Data have been pooled across gender and test site. Dashed diagonal lines on the right panel indicate fits to the Gompertz model. Arrows at 39 weeks indicate start of rapamycin exposure.

