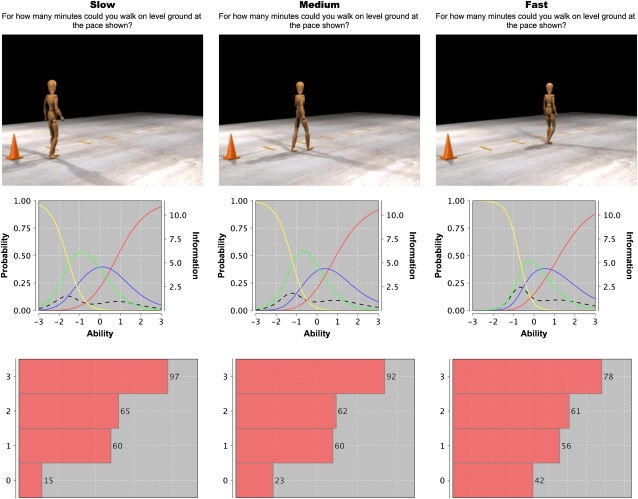
Figure 1.
Screenshot, Item Characteristic Curve, information curve, and histogram of responses for the item asking “For how many minutes could you walk on level ground at the pace shown?” Responses to the four categories (0, 1, 2, and 3, respectively, in the histogram) are none and 1 (yellow line), 5–15 (green line), 20–30 (blue line), and >30 minutes (red line). The four lines represent the probability of each response across the range of function and the y-axis is on the left. The dotted line represents the information curve, and the y-axis on the right provides the scale. The image from the video shows the position of the mannequin at the same instant in time, reflecting the differences in walking speed (slow, medium, and fast).

