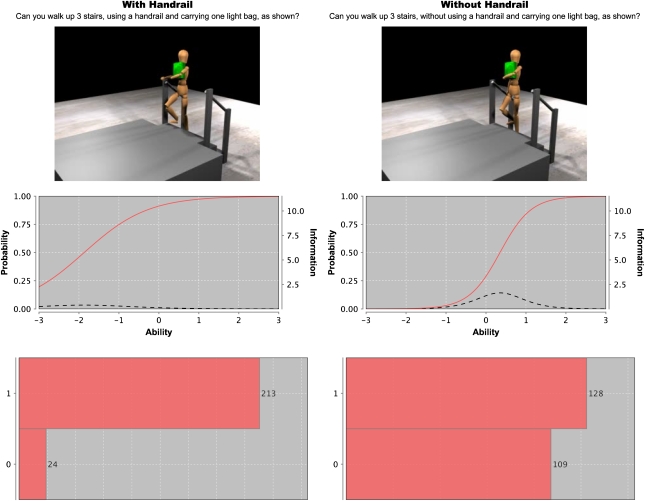
Figure 4.
Screenshot, Item Characteristic Curve (ICC), and histogram of responses for the item asking “Can you walk up 3 stairs, using/without using a handrail and carrying one light bag, as shown?” Responses are yes = 1 and no = 0. For the ICC, the red line represents the probability of being able to do the task across the range of function and the y-axis is on the left. The dotted line represents the information curve, and the y-axis on the right provides the scale.

