
Figure 4. Mortality and cardiac remodeling is increased in β2a mice after MI.
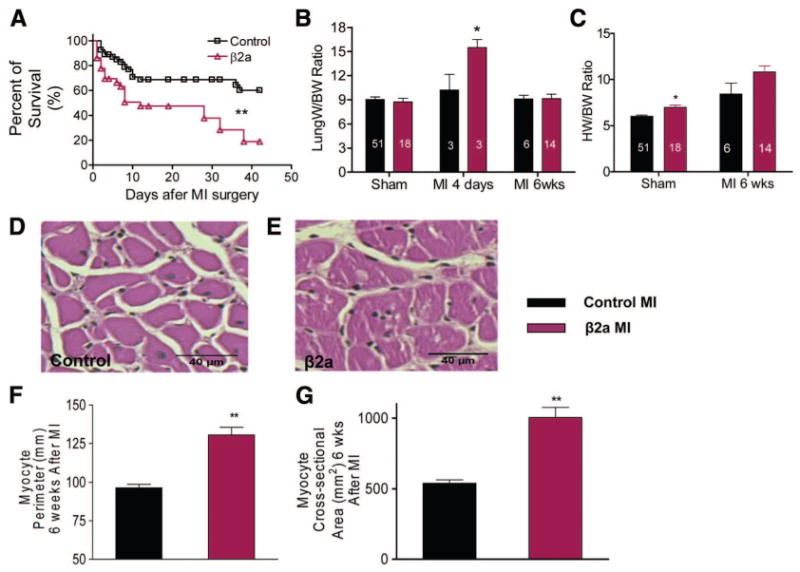
A, Kaplan–Meier survival curves during 6 weeks after MI in control (n=54) and β2a (n=36) mice. B and C, HW and lung weight (Lung W) were normalized to BW in control and β2a mice. D and E, Representative hematoxylin/eosin-stained sections from control and β2a hearts. F and G, Myocyte cross sectional area and perimeter in control (n=3) and β2a hearts (n=3). Numbers in the bars are the numbers of animals examined. **P<0.01; *P<0.05.