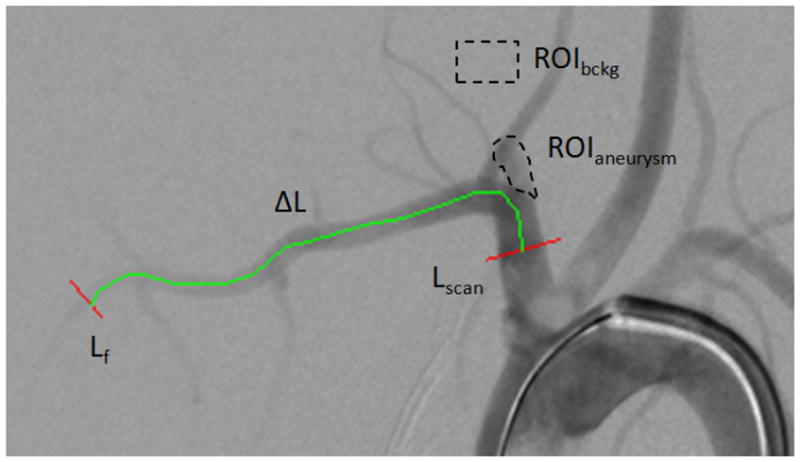
Figure 2.

DSA snapshot of an elastase model aneurysm. ROIaneurysm is the area were the contrast integral is calculated ROIbckg where the average background pixel is evaluated, Lscan and Lf represent reference line profiles taken across the main artery, and are used for the bolus velocity derivation, ΔL is the vessel length between the two reference line.
