Figure 2. Geographic distributions of malaria-attributed mortality and slide P. falciparum rate.

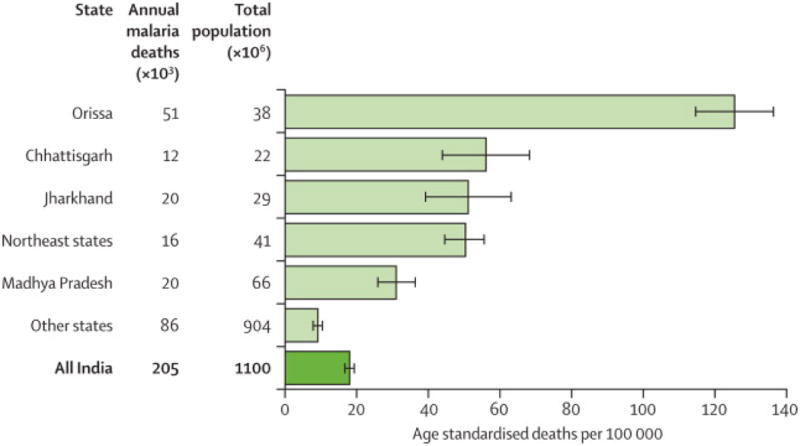
(a) Percentage of 2001-2003 mortality attributed to malaria in this study at ages 1 month to 69 years. Mortality is plotted as the smoothed results from the 5335 study areas with some malaria-attributed mortality, mapped to the locations of their PIN code addresses. (b) District-level 1995-2005 slide falciparum rate from the National Vector-borne Disease Control Programme statistics.5, 22 High-malaria states comprise Orissa (OR), Jharkhand (JH), Chhattisgarh (CG) and Assam and all the smaller northeastern states except Sikkim (NE).
