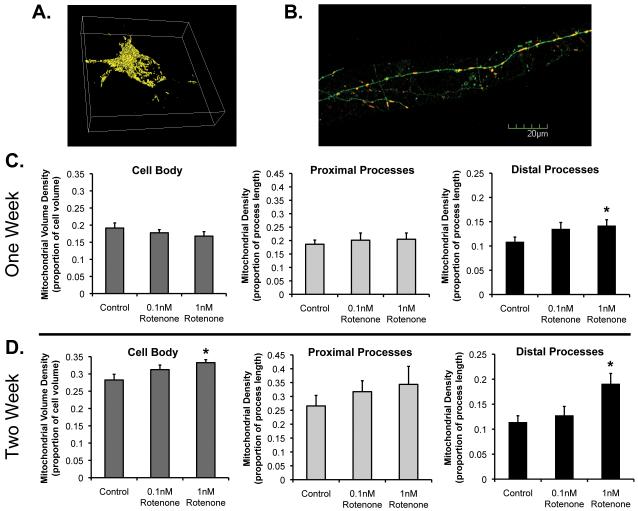
Figure 4.
Mitochondrial density after chronic rotenone exposure. Cortical neurons were treated as described previously, and images taken as described in Methods. A, Example of 3D Metamorph reconstruction of fluorescent mitochondria in neuronal cell body for volume measurements. B, Example of soluble GFP-expressing neurites with mtDsRed2 in distal process. C-D, Mitochondrial density in cell body, proximal neurites, or distal neurites after one or two weeks of rotenone exposure or vehicle control. *Rotenone treatment conditions significantly different than vehicle control. In addition, there are age-related changes, unmarked in graph: control-treated neuronal cell bodies have greater mitochondrial density at the two week time point (DIV21) than at the one week time point (DIV14; p=0.005), but are not statistically significantly different in the other regions at those time points.

