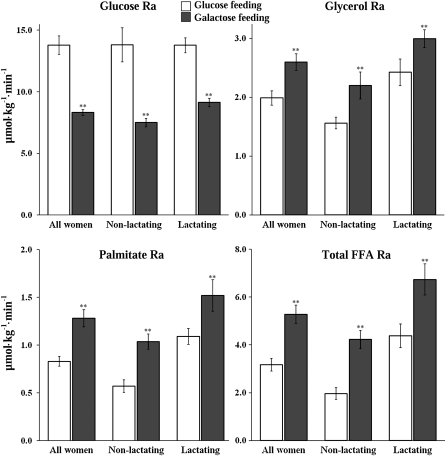
FIGURE 1.
Mean (±SEM) rates of appearance (Ra) of glucose, glycerol, palmitate, and total free fatty acids (FFAs) during the feeding of glucose (□) and galactose (▪) in all women combined (n = 14), in nonlactating women (n = 7), and in lactating women (n = 7). The calculations are based on total body weight (kg). Post hoc procedures provided by Generalized Estimating Equations were used to perform the comparisons of glucose and galactose within groups and in all women combined. **Significant difference between the glucose and galactose diets, P < 0.01.

