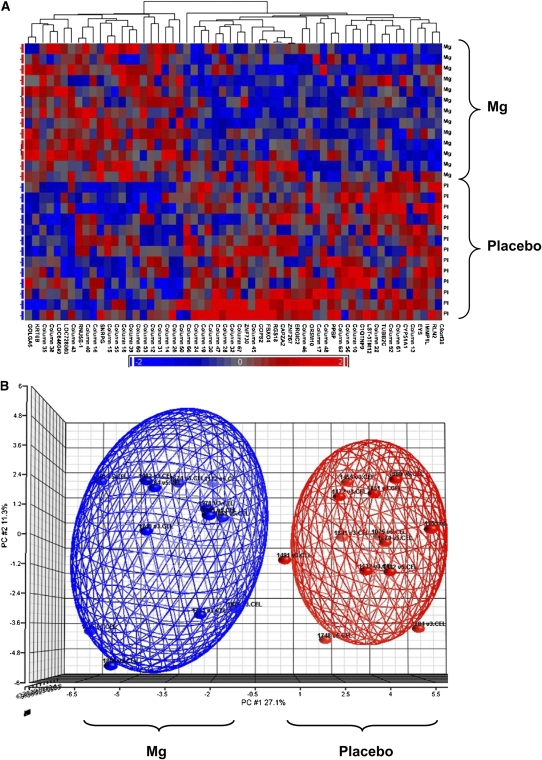
FIGURE 2.
A: Gene expression patterns for 58 genes differentially regulated after magnesium (n = 13) and placebo (n = 13) treatments with the Affymetrix microarray (Affymetrix, Santa Clara, CA). Each row represents one study participant, and differentially expressed genes are shown in columns. B: Principal components (PC) analysis, which revealed similar gene expression profiles within each treatment of 58 differentially expressed genes. Cluster and PC analyses were performed on the list of differentially expressed genes generated by using ANOVA.

