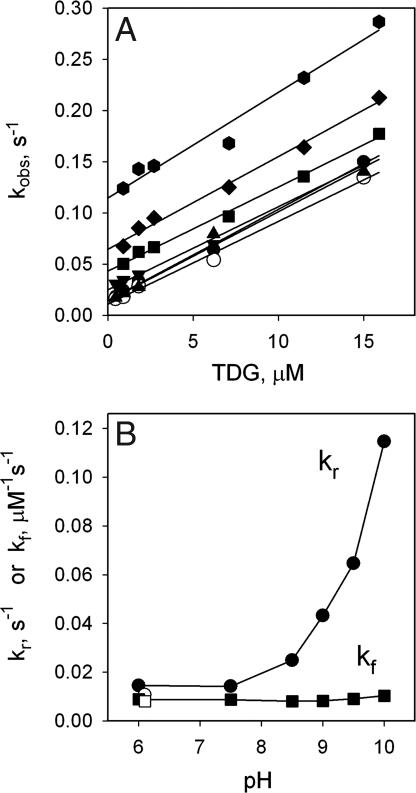
Fig. 5.
Kinetics of TDG binding to MIANS-labeled V331C LacY as a function of pH. (A) TDG concentration dependence of the rate of fluorescence change (kobs) at given ambient pH values. Details of data collection and fitting are described in Fig. 3. Solid lines are linear fits to each dataset at pH 6 (●), 7.5 (▴), 8.5 (▾), 9.0 (■), 9.5 (♦), and 10.0 (⬣). ○, control experiment at pH 6.1 with labeled protein preincubated at pH 11.0 for 12 min. (B) Kinetic parameters of kr (●) and kf (■) estimated from A for each dataset are plotted as a function of pH. ○, □, kf and kr, respectively, for protein preincubated at pH 11.0 for 12 min and returned to pH 6.1 (in addition, see Fig. S6 for comparison of Kdapp values calculated from kinetic parameters and obtained from titration data).

