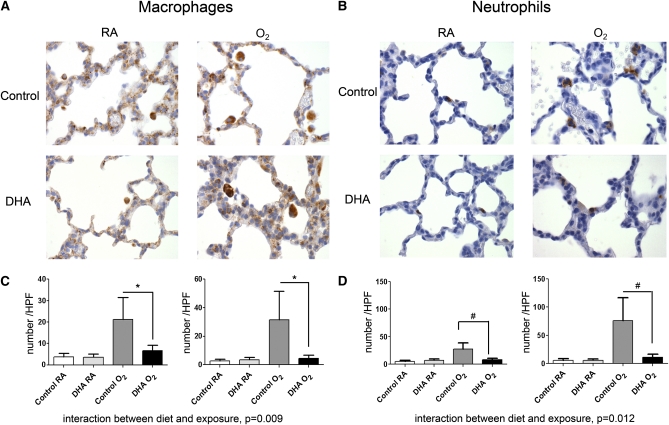
FIGURE 3.
Immunohistochemistry (A,B) and morphometric analysis (C,D) of macrophages (A,C) and neutrophils (B,D) in pup lung tissues at d 3 (left) or d 7 (right). Photos were taken at 400x magnification. Data were collected by assessing 1 histological section per mouse, counting 5 independent fields per section and using the mean of the 5 fields as a single data point. Data were ln-transformed prior to analysis and back-transformed for the figure. Data are as means ± SEM, n = 5–8 pups (2–4 litter pairs, 2–5 litters). Symbols indicate that the groups differ: *P = 0.004, #P = 0.001.

