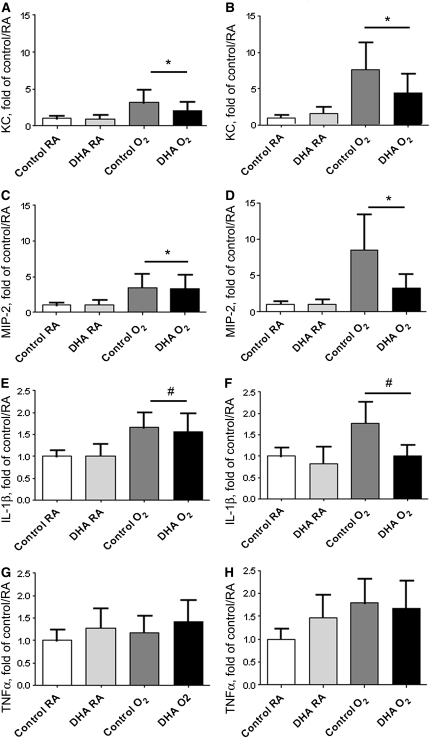
FIGURE 4.
KC (A,B), MIP-2 (C,D) and cytokine (E–H) mRNA levels in lungs of pups nursed by dams fed control or DHA diets and exposed to RA or hyperoxia (<95% O2) at d 3 (left) or d 7 (right). Relative expression was measured using qRT-PCR with cycle numbers normalized to β-actin as a loading control. Data were normalized to the control/RA means on each day. Statistical analyses were performed on the ΔCT values. Data are means ± SEM, n = 5–6 pups (2–4 litter pairs, 3–5 litters). Symbols indicate the effect of exposure, *P < 0.001, #P = 0.009.

