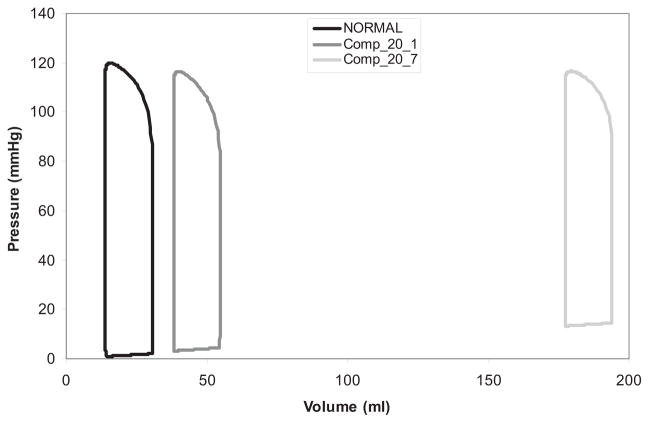
Fig 5.
Pressure-volume (PV) loops generated for model simulations. Normal PV loop for normal (noninfarcted) simulation. With a 20% infarct, the compensated simulation indicates a greater rightward shift in the PV loop for the more compliant infarct (green) compared with the stiffest infarct (yellow).

