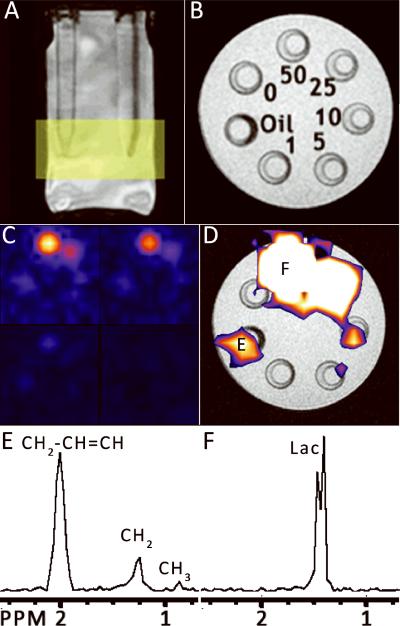
Figure 3. HDMD-SelMQC-CSI images of lactate phantoms.
(A) A localizer image shows the 15 mL conical phantoms containing lactate submerged in water. The yellow rectangle shows the slab position for the Hadamard slice selection. (B) A cross section of the phantoms from the localizer. The numbers indicate the concentration of lactate in each phantom or the 100% safflower seed oil phantom. In (C), the results of the lactate imaging are shown as the magnitude integral of the area from 1.1 to 1.5 ppm in each of the 4 slices. These slices begin at the top slice in the top left and proceed downwards in clockwise order. The bottom slice is entirely out of the tubes and shows only noise. (D) Overlaid upon the localizer image from (B) is the integrated signal from the top slice (upper left corner of (C)), shown with threshholding to remove the noise signal. The letters marked E and F correspond to the spectra (E) and (F), where E is the oil phantom and F is the 50 mM lactate phantom. These are magnitude spectra zoomed into the area of interest (0.75 – 2.5 ppm).

