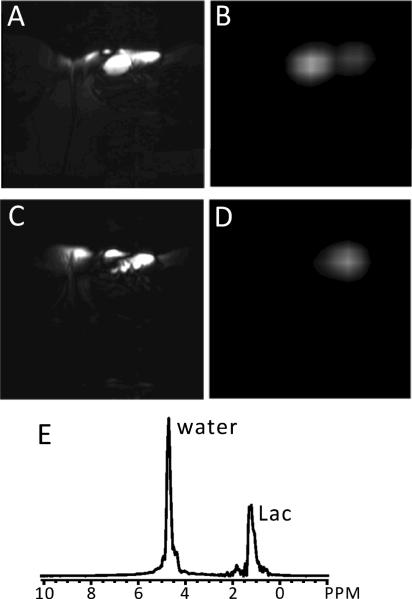
Figure 6. HDMD-SelMQC-CSI lactate images from an NHL patient.
(A) and (C) show T2-weighted images and (B) and (D) are the corresponding HDMD-SelMQC-CSI lactate images from a 34 yr old female diffuse large B-cell non-Hodgkin's lymphoma patient having a tumor in the inguinal node of the upper right thigh. In the T2-weighted axial images (A and C) two nodes of 25 mm × 25 mm × 40 mm and 20 mm × 15 mm × 35 mm were observed. The two slice lactate images (B and D) match well with the slices from T2-weighted images. Part (E) shows a magnitude spectrum from a voxel of tumor in (B). The peak centered at 1.3 ppm is considered to be lactate (Lac, with minimal lipid contamination as per the discussion) with residual water (4.7 ppm) included. This water can be completely removed by adding water suppression pre-pulses, but has not been large enough to cause errors due to receiver saturation.

