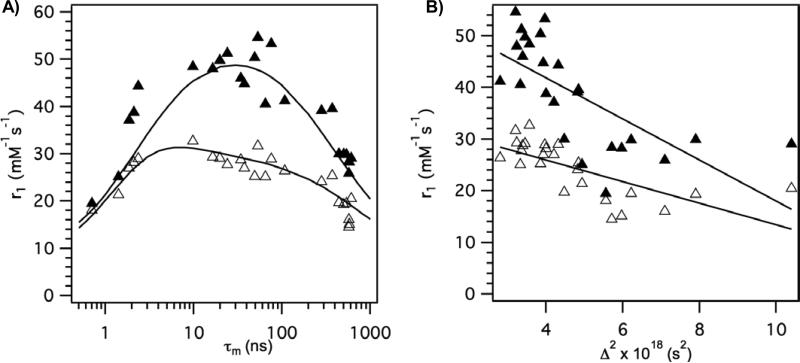
Figure 9.
A) Relaxivity of complexes in HSA solution at 37 °C plotted versus measured water residency time at 37 °C with data at 0.47T (filled symbols) and 1.4T (open symbols). Solid lines are curves generated using the mean molecular parameters listed in Table 1. B) Relaxivity of complexes in HSA solution at 37 °C plotted versus measured transient zero field splitting parameter Δ2, a measure of electronic relaxation rate, with data at 0.47T (filled symbols) and 1.4T (open symbols). Solid lines are linear regressions.

