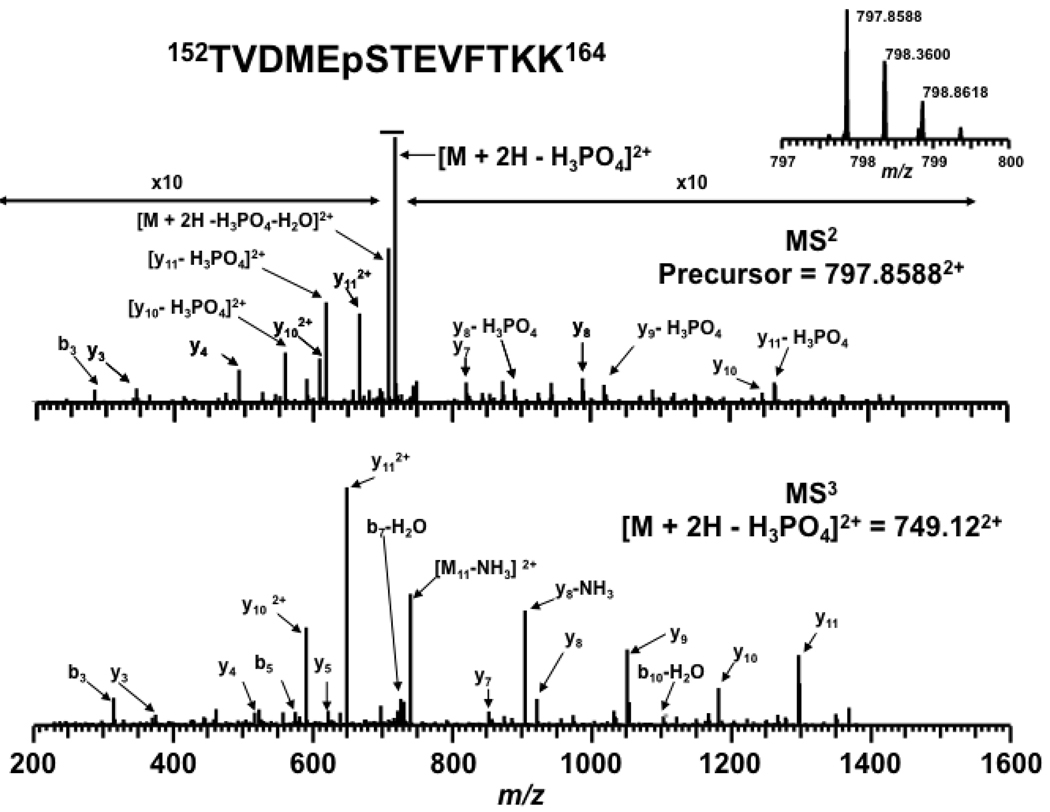
Figure 1.
Identification of phosphorylation sites using hierarchical MS2/MS3 data analysis. (Top) MS2 spectrum of the doubly charged precursor ion at m/z of 797.86 Da. (Bottom) MS3 spectrum of neutral loss product ion at m/z 749.12. The peptide was identified as α-casein S2 phosphopeptide 152TVDMEpSTEVFTKK164. The MS2 spectrum is magnified to accentuate the lower abundant y ions and b ions.

