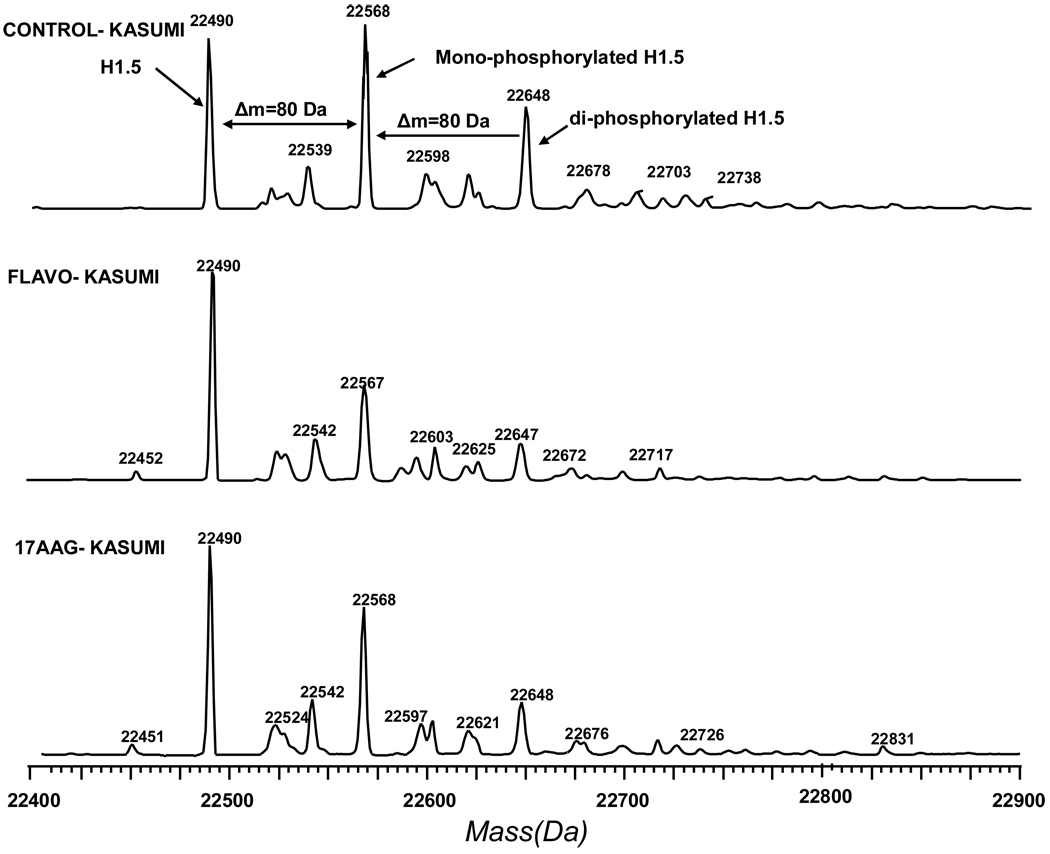
Figure 3.
Deconvoluted mass spectra of H1.5. Top: Mass distribution of Histone H1.5 from control Kasumi-1 cells, the first peak at 22,490 Da is the mass peak of unmodified H1.5, the peak at 22,567 Da is mono-phosphorylated H1.5, the peak at 22,648 Da is diphosphorylated H1.5; Middle & Bottom: Mass distribution of histone H1.5 from Kasumi-1 cells treated with Flavopiridol and 17 AAG, respectively. Mono- and di-phosphorylated H1.5 peak magnititude of the cells treated by Flavopiridol and 17 AAG was decreased compared to the mass spectra of the control sample.

