
Figure 1.
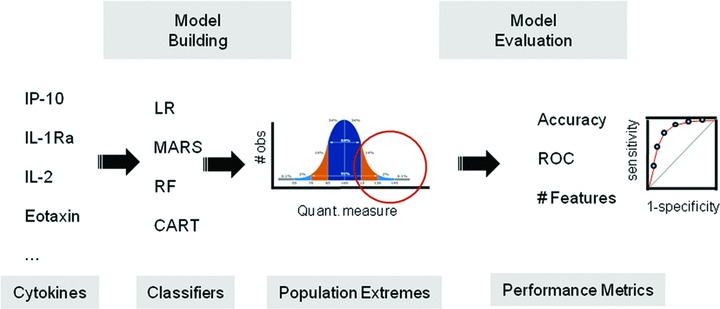
Study Overview. Shown is a schematic diagram of the approach in this study to identify the most reliable statistical learning methods (“classifiers”) that map the relationship between BAL cytokines and population extremes of intermediate phenotypes in asthma.