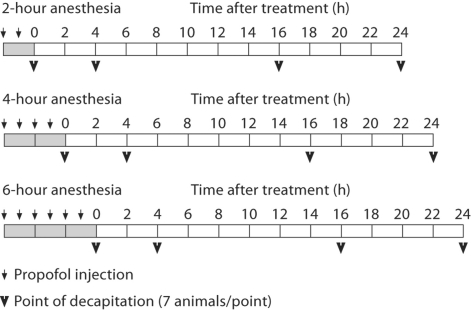
Fig. 1.
Timeline of the experiments. Each rectangle marks a 2-hour time period, the gray color represents the duration of the anesthesia. Time point 0 indicates termination of anesthesia. Small arrows point to propofol injections (20 mg/kg), and the arrowheads indicate the postexposure intervals at which the animals were killed.

