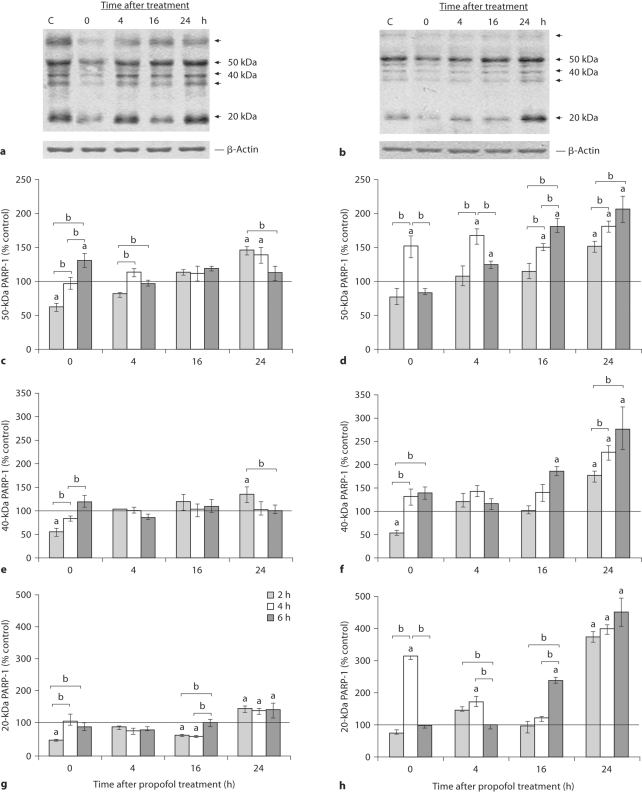
Fig. 3.
Time course of appearance of PARP-1 cleavage fragments in the cortex and thalamus of P7 rats after exposure to propofol for 2, 4 and 6 h. Whole-cell extracts were used to detect the presence of 50-, 40- and 20-kDa PARP-1 fragments in the cortex (a) and the thalamus (b). Bars represent quantitative densitometric evaluation of the approximately 50-kDa PARP-1 fragment in the cortex (c) and the thalamus (d), the approximately 40-kDa PARP- 1 fragment in the cortex (e) and the thalamus (f), and the approximately 20-kDa PARP-1 fragment in the cortex (g) and the thalamus (h). Results are presented for animals at different recovery time points (0, 4, 16 and 24 h) after exposure to propofol for 2, 4 and 6 h. Representative immunoblots of the 2-hour treatment are shown. β-Actin was run as an internal standard for equal loading. Results are presented as means ± SEM. a p < 0.05 vs. control value presented as a black line, b p < 0.05 between treatments.

