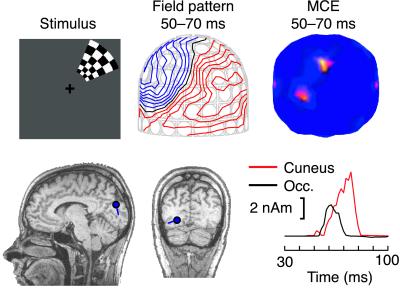
Figure 1.
Data of Subject 1 after right upper quadrant BW pattern reversal. Magnetic field pattern and the corresponding MCE results, viewed from the back of the head, are integrated from 50 to 70 ms. The red contours in the magnetic field display indicate the magnetic flux coming out from the head and the blue contours the magnetic flux entering the head. The blue dots and lines on the individual MRIs represent the center and orientation of the estimated current. The red and black curves show the strengths of the anteromedial cuneus and left occipital (Occ.) sources as a function of time.

