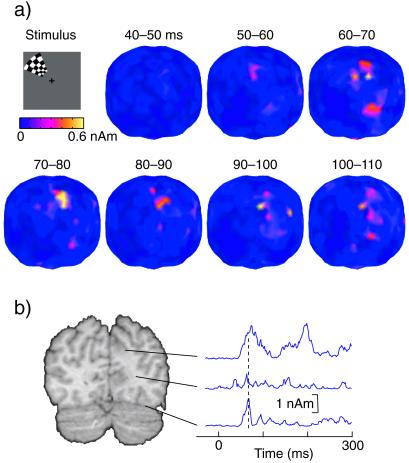
Figure 3.
(a) Group average MCEs after left upper quadrant pattern reversals, integrated over successive 10-ms intervals after stimulus. (b) Spherical smooth-edged regions of interests with 8-mm radius are placed close the higher and lower current clusters and between. The ROIs are presented on the standard brain MRI (18). The right column shows the signal strength of these ROIs as a function of time.

