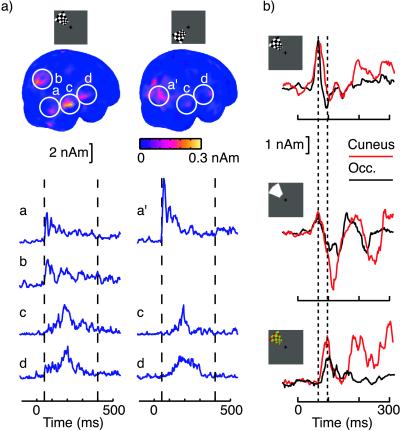
Figure 4.
(a) Group average MCE after left upper and left lower quadrant pattern reversals, integrated from 50 to 400 ms after stimulus. Note that averaging the signal from 50 to 400 ms makes the earliest transient activation poorly visible. The four distinct ROIs are in the posterior inferior occipital cortex (a and a′), in the anteromedial cuneus (b), in the temporooccipital junction (c), and in the superior temporal sulcus (d). After left lower quadrant stimuli, the group average MCE separate poorly the cuneus and occipital sources because the two areas are close together and there is some interindividual variance in locations—the two distinct sources were better separable in individual data. (b) Group average amplitude as a function of time for BW pattern reversal, luminance onset, and equiluminant RG pattern reversal stimuli at the left upper quadrant. The dashed vertical lines indicate latencies at 67 and 97 ms. The amplitude curves reflect group average activity at the mean locations of the individual sources, determined from BW data.

