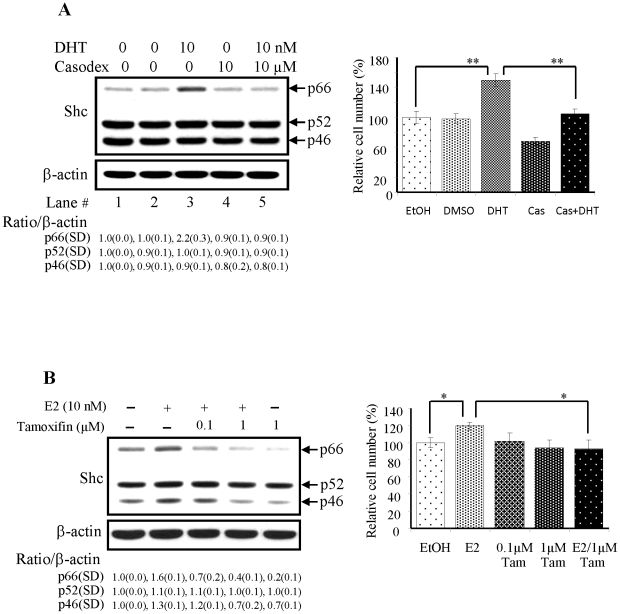
Figure 1. Effects of steroids on p66Shc protein levels in PCa and OVa cells and their proliferation.
LNCaP C-33 and CAOV-3 cells were plated in duplicates in the regular medium as described in the methods for 72 h and then maintained in a steroid-reduced medium for 48 h. Cells were treated with steroids plus or minus the corresponding antagonists as specified in each figure for 48 h. After harvested, lysates were analyzed by western blotting with Abs against total Shc and β-actin protein, respectively. The level of β-actin protein was detected as a loading control. The intensity of each Shc protein hybridization band was semiquantified, and the ratio to the corresponding β-actin protein was calculated and then normalized to that of corresponding control cells which received the solvent alone. To determine cell growth, cell number was analyzed by cell counting. The figure is a representative of three sets of independent experiments in duplicates and the cell growth is expressed as means ± SE (n = 3). (A) LNCaP C-33 cells were treated with or without DHT (10 nM), plus or minus casodex (10 µM) for 48 h. Left panel: Lane 1, cells received EtOH as a control; Lane 2, cells received DMSO as a control; Lane 3, cells received DHT in EtOH; Lane 4, cells received casodex in DMSO; Lane 5, cells received both DHT & casodex. Right panel: Cell growth was analyzed by cell counting. (n = 2×3, **P<0.001). (B) Left panel: CaOV-3 cells treated without or with E2 (10 nM), tamoxifen (0.1 and 1 µM) for 48 h. Right panel: Cell growth was analyzed by cell counting. (n = 2×3, *P<0.05). SD, Standard deviation.

