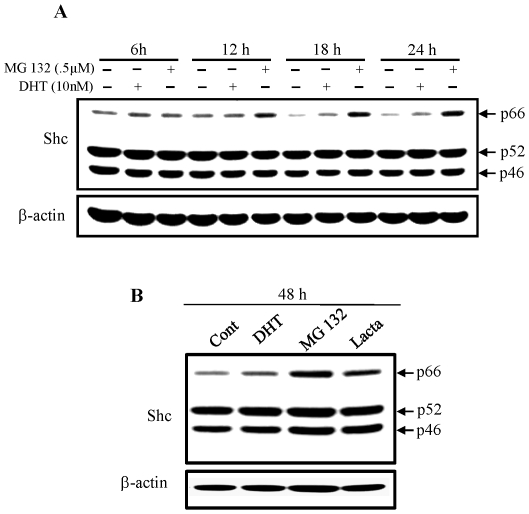
Figure 4. Kinetic analyses of DHT and proteasomal inhibitors on p66Shc protein levels.
LNCaP C-33 cells were plated in regular medium for 72 h, steroid starved for 48 h, and then cells were treated without or with DHT (10 nM), MG 132 (0.5 µM) or Lactacystin (1 µM) for various time periods as indicated in the figure. Cells were harvested and lysates were analyzed by western blotting with Abs against total Shc protein and β-actin protein, respectively. The level of β-actin protein was detected as a loading control. The figure is a representative of three sets of independent experiments. (A) Cells were treated with DHT (10 nM) or MG132 (0.5 µM) and harvested at 6 h, 12 h, 18 h and 24 h and (B) cells were treated with DHT (10 nM), MG132 (0.5 µM) or Lactacystin (1 µM)) and harvested at 48 h after treatment.

