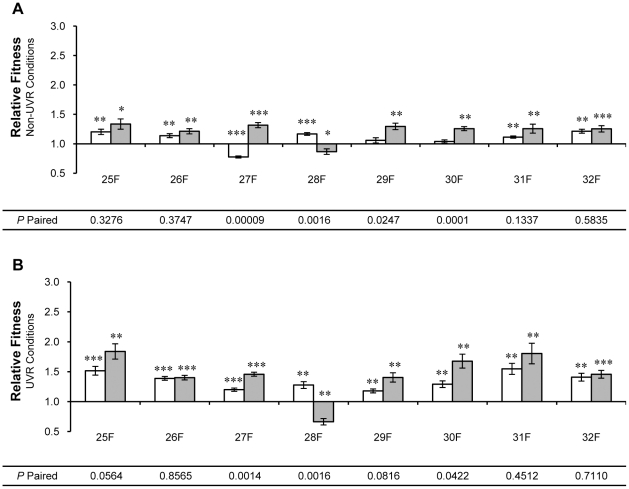
Figure 5. Relative fitness of ‘fuzzy’ (F) isolates from UVR lineages 25-32.
Relative fitness was measured by direct competition with the ancestor under (A) non-UVR and (B) UVR conditions. Single isolates of P. cichorii 302959 exhibiting the ‘fuzzy’ colony morphology were taken after 250 (open bars) and 500 (shaded bars) generations of experimental evolution. Fitness values are means and error bars represent standard error of the mean. Values are significant by two-tailed independent t-test (d.f. = 5, α = 0.05) where indicated (* P<0.05, ** P<0.01, *** P<0.001). P-paired values correspond to two-tailed paired t-tests (d.f. = 5, α = 0.05) between relative fitness values for isolates from generation 250 and 500.

