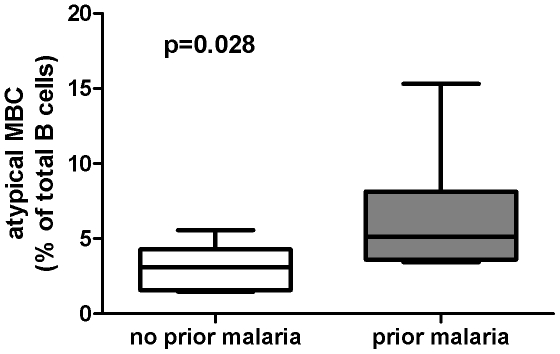
Figure 2. Atypical MBCs in Peruvian adults by self-reported history of prior malaria episodes.
Atypical MBCs were detected by flow cytometry and expressed as a percentage of total B cells in the peripheral blood of Pf-infected Peruvian adults who did (n = 12) or did not (n = 6) self-report a prior history of malaria. Box-and-whisker plots represent the smallest and largest values (whiskers), the lower and upper quartiles (top and bottom of box), and the median (horizontal line across box). The Mann-Whitney test was used to compare continuous variables between groups.

