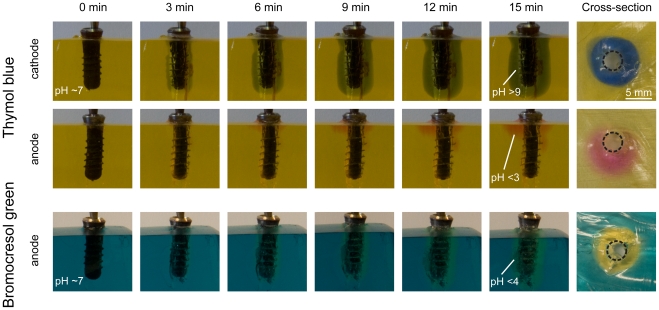
Figure 3. Proof of pH changes during electrochemical implant treatment.
Photographic images of dental implants in simulated soft tissue using pH-sensitive dyes to visualize local pH changes. The dark blue color for thymol blue indicated a pH above 9 (alkaline) while the pink color confirmed a pH below 3 (strongly acidic). Confirmation with a second pH-sensitive dye, bromocresol green allowed mapping a similar acidic pH at the anode. For both dyes, a homogenous, circular simulated soft tissue section of high/low pH evolved around the implant insertion hole.

