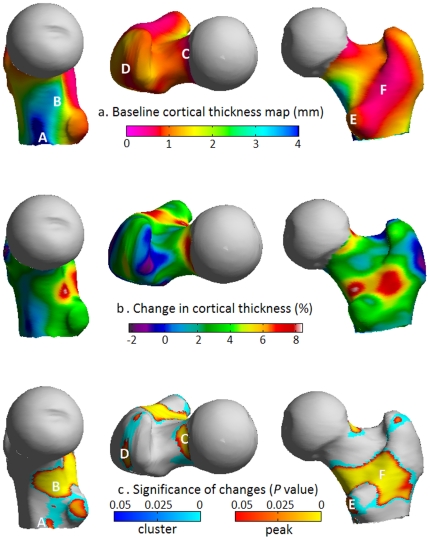
Figure 2. Cortical thickness maps showing severe osteoporosis and the increase in thickness following hPTH-(1-34) treatment.
(a) Medial, superior and posterior views of the average pre-treatment cortical thickness map in advanced osteoporosis showing remnants of thicker, highly loaded bone (blue/green) at A) the inferomedial cortex and B) the calcar femorale regions. Elsewhere there is thin, sub-millimetre cortex (pink/red) at key fracture sites including C) the subcapital superior neck region. Also labelled are the insertion sites of key muscles of locomotion; D) gluteus medius, E) psoas major and F) quadratus femoris (on the inter-trochanteric crest). (b) Post-treatment percentage change and (c) statistical significance maps which together indicate regeneration of bone at A), B), C), D), E) and F).

