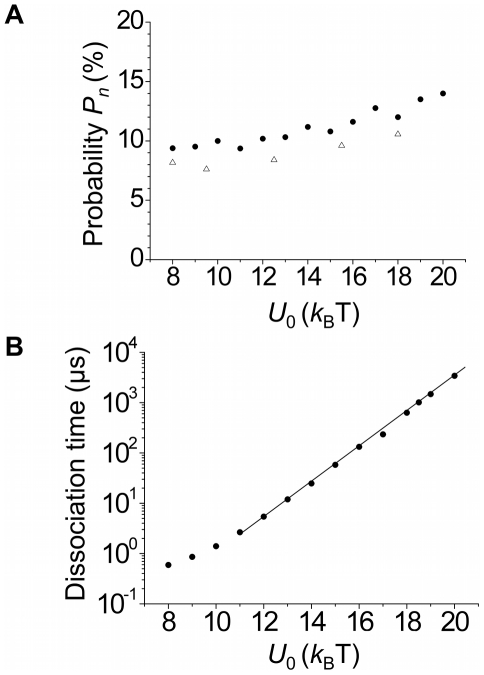
Figure 3. Calculated results on dynamics of flap DNA transition from PolI's polymerase active site to 5′-nuclease active site or dissociation into solution.
(A) Probability, Pn, for the DNA to transit to the 5′-nuclease active site versus the interaction strength U 0. (B) Mean time, Td, for the DNA to detach from the polymerase or to transfer to the 5′-nuclease active site versus the interaction strength U 0. Filled dots represent results with potentials given by Eqs. (2)–(7), with forms of U (x, 0, 0), U (0, y, 0) and U (0, 0, z) shown in Figure S2; while unfilled triangles represent results with forms of potentials U (x, 0, 0), U (0, y, 0) and U (0, 0, z) shown in Figure S7.

