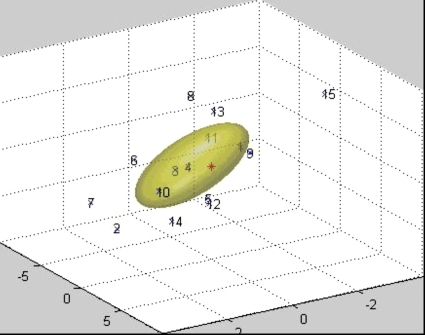
Figure 2.
Cluster of points generated by iteratively mapping a point in the source image. Numbers show the iteration at which each point was obtained. The numberless point represents the original point. The ellipsoid represents the 50% isosurface of the initial 3D Gaussian distribution calculated from the cluster.

