
Figure 2. MicroCT analysis of cortical bone in the Ts65Dn femur.
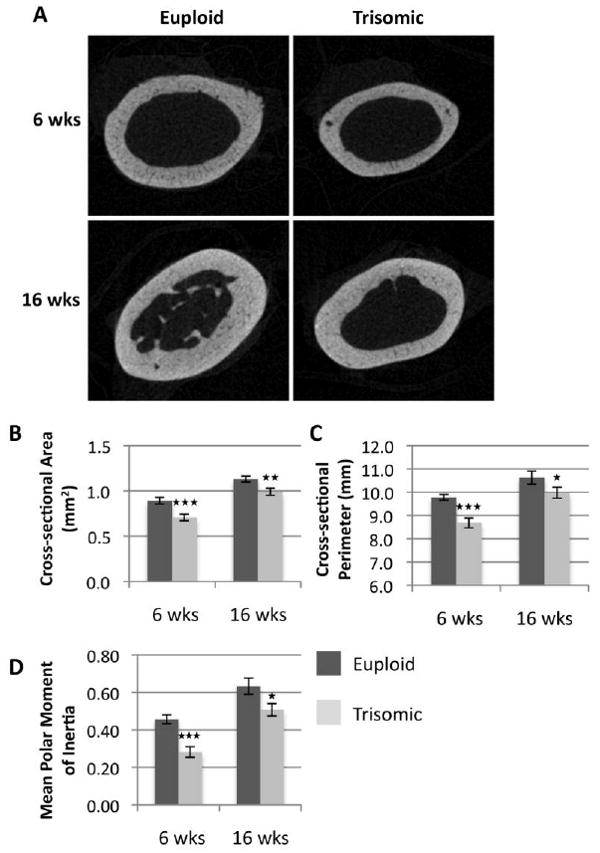
MicroCT images of the femur midshaft in euploid and trisomic mice at the ages of 6 and 16 weeks (A). Analysis revealed significant reductions in MPMI (B), cross-sectional bone area (C), and periosteal bone perimeter (D). (Eu 6 wks, n= 12; Ts 6 wks, n= 10; Eu 16 wks, n= 10; Ts 16 wks, n= 15) (*p ≤ 0.05, **p ≤ 0.01, *** p ≤ 0.001)