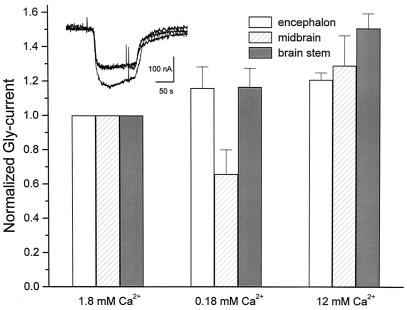
Figure 5.
Gly current modulation by calcium. The columns represent the mean + SEM (n = 3) of Gly-currents elicited by 1 mM Gly in the presence of different Ca2+ concentrations. (Inset) Currents elicited by 1 mM Gly in normal Ringer's solution, and in the presence of high Ca2+ (12 mM) in an oocyte injected with midbrain mRNA.

