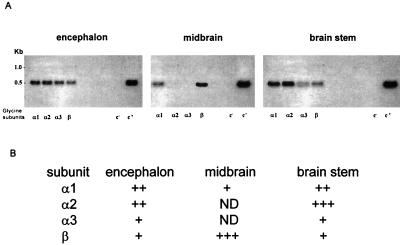
Figure 7.
Distribution of GlyR-subunit transcripts. (A) The lanes show the GlyR subunits present in encephalon, midbrain, and brainstem mRNAs amplified by RT-PCR. Subunits: α1-, α2-, α3-, and β- as well as negative (c−, water) and positive (c+, glyceraldehyde-3-phosphate dehydrogenase) controls. (B) Semiquantitative signals in 1.5% agarose gel; the signals were designated weak, +; moderate, ++; and intense, +++. ND, not detected. Note that the α1- and β-subunits were amplified from all mRNAs, and that the α2- and α3-subunits were present in encephalon and brainstem but not in the midbrain.

