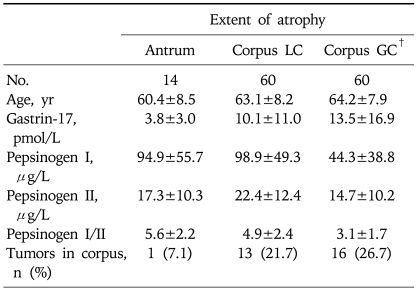
Table 3.
Pepsinogen Profiles according to the Topographic Extent of Gastric Atrophy (n=134)*
Continuous variables are shown as mean±SD.
LC, lesser curvature; GC, greater curvature.
*In eight patients, biopsy samples were inadequate to evaluate gastric atrophy; †Patients with corpus GC atrophy show significantly lower pepsinogen I and I/II levels than those in whom the atrophic extent was limited to the corpus LC (p<0.01) or antrum LC (p<0.01).

