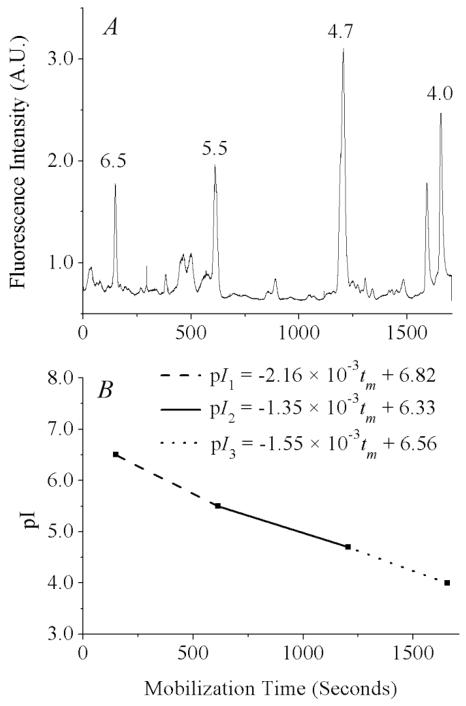
Figure 1.
pH gradient determination using internal standards. (A) Signal from fluorescent pI markers after median filtering to remove narrow spikes. Separation conditions: 1% Biolyte 3–10, 1% Biolyte 4–6, 230 mM sucrose, 0.02 ng/mL of each fluorescent pI marker. The anolyte, catholyte, and chemical mobilizer were 100 mM H3PO4, 20 mM NaOH, and 350 mM acetic acid. The electric field applied during focusing and mobilization was 400 V/cm. Detection was at 535 ± 17.5 nm, data acquisition was at 100 Hz, 1000 V was applied to the PMT. (B) pH gradient, as determined by mobilization times of the four pI markers.

