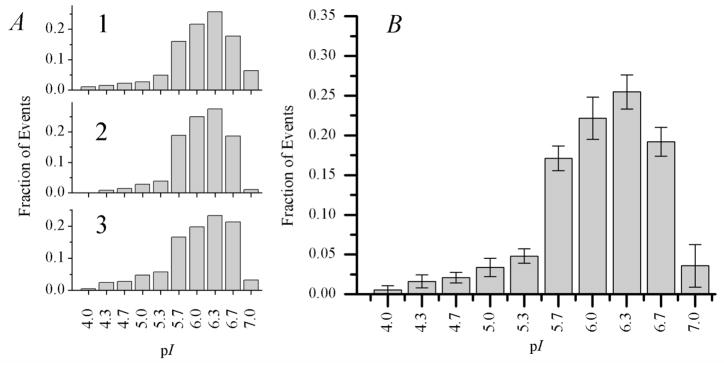
Figure 3.
Mitochondrial pI distributions from three consecutive cIEF runs. (A) Individual distributions from each run. The total number of mitochondrial events detected is 451, 360, and 405 for 1, 2, and 3. Each plot is normalized to the total number of mitochondrial events from that run. (B) Mitochondrial pI distribution, pooled from the three consecutive cIEF runs. Error bars for each bin represent plus or minus one standard deviation between the three runs. The total number of mitochondrial events detected is 1216.

