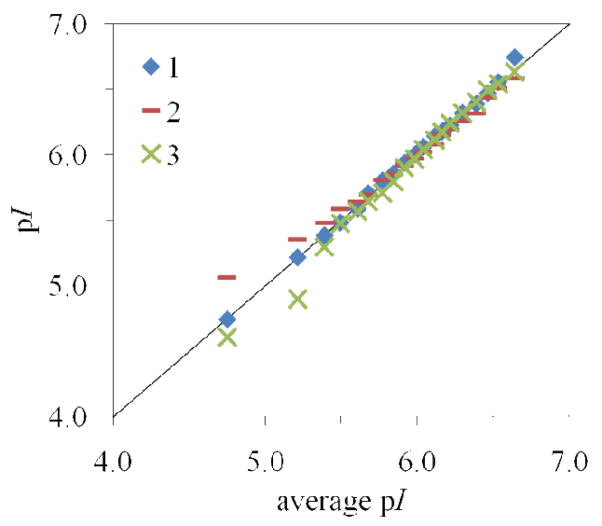
Figure 4.
Q-Q plot to assess reproducibility of three consecutive cIEF runs. The percentiles from each run (y-axis) are plotted against the percentiles of the pooled data (x-axis). This plot is a qualitative indication that the distributions are very reproducible above pI 5.5. The sums of squares of the residuals are 0.015, 0.150, and 0.145 respectively for runs 1, 2, and 3.

