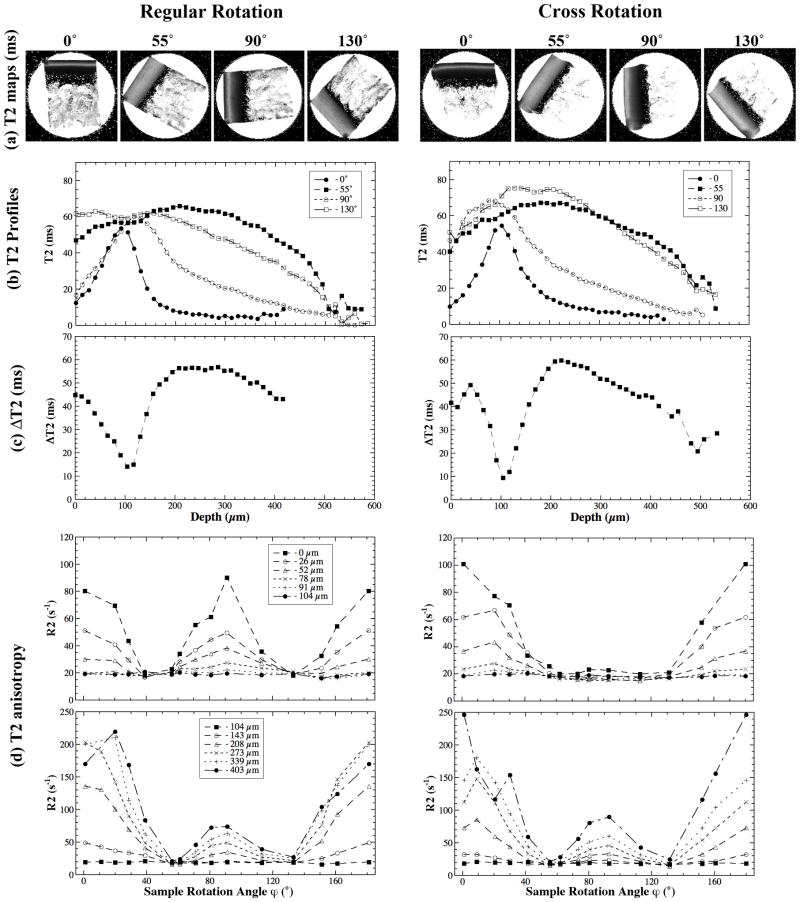
Fig 3.
T2(R2) anisotropy of articular cartilage during regular and cross rotations. (a) T2 images at selected orientations. (b) T2 profiles as the function of tissue depth relative to cartilage surface. (c) The max variation of the T2 at each tissue depth. (d) The depth-dependent anisotropy profiles of R2 at some selected tissue depths.

