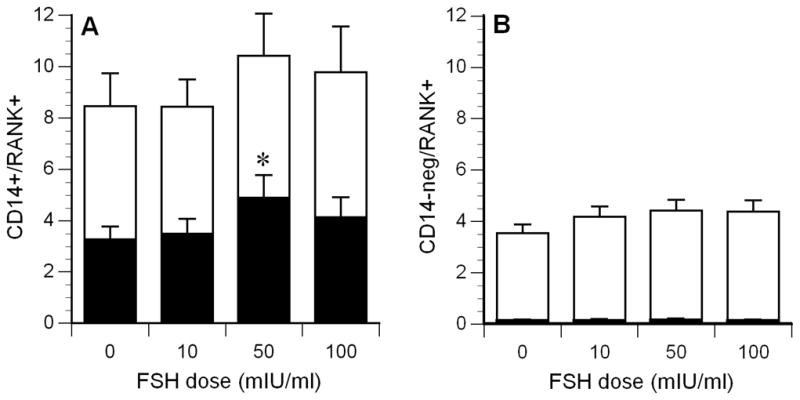
Figure 2.

Mean RANK expression on CD14+ mononuclear cells (panel A) and CD14-negative cells (panel B). The top of the white bars indicates the total percentage of RANK positive cells, the black bars indicate the percentage of RANKhigh cells (RFI > 3000, extremely low in panel B). *P = 0.02, compared to control condition (0 FSH). N=9.
