
Figure 3.
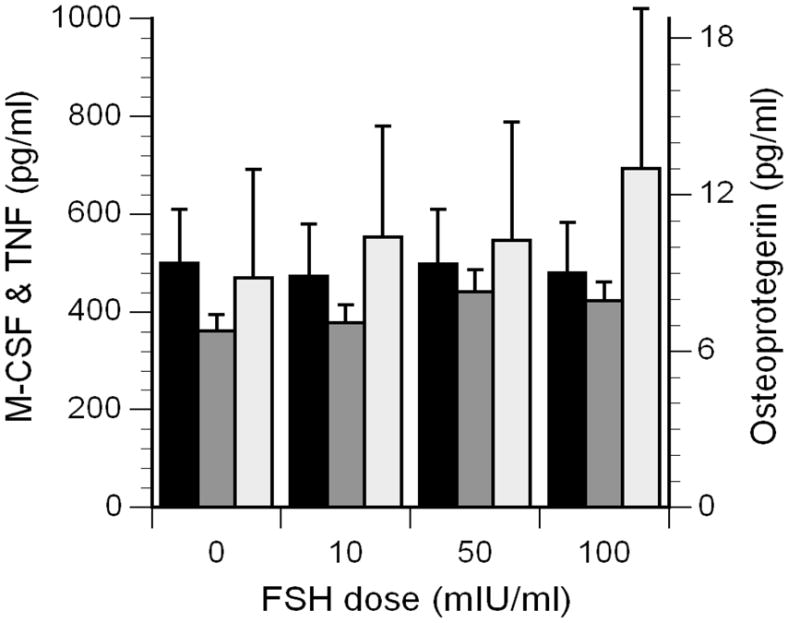
Concentrations of M-CSF (black bars, scale on left), OPG (dark gray bars, scale on right), and TNFα (light gray bars, scale on left) in the supernatants of mononuclear cells cultured with FSH.
Official websites use .gov
A
.gov website belongs to an official
government organization in the United States.
Secure .gov websites use HTTPS
A lock (
) or https:// means you've safely
connected to the .gov website. Share sensitive
information only on official, secure websites.
Concentrations of M-CSF (black bars, scale on left), OPG (dark gray bars, scale on right), and TNFα (light gray bars, scale on left) in the supernatants of mononuclear cells cultured with FSH.