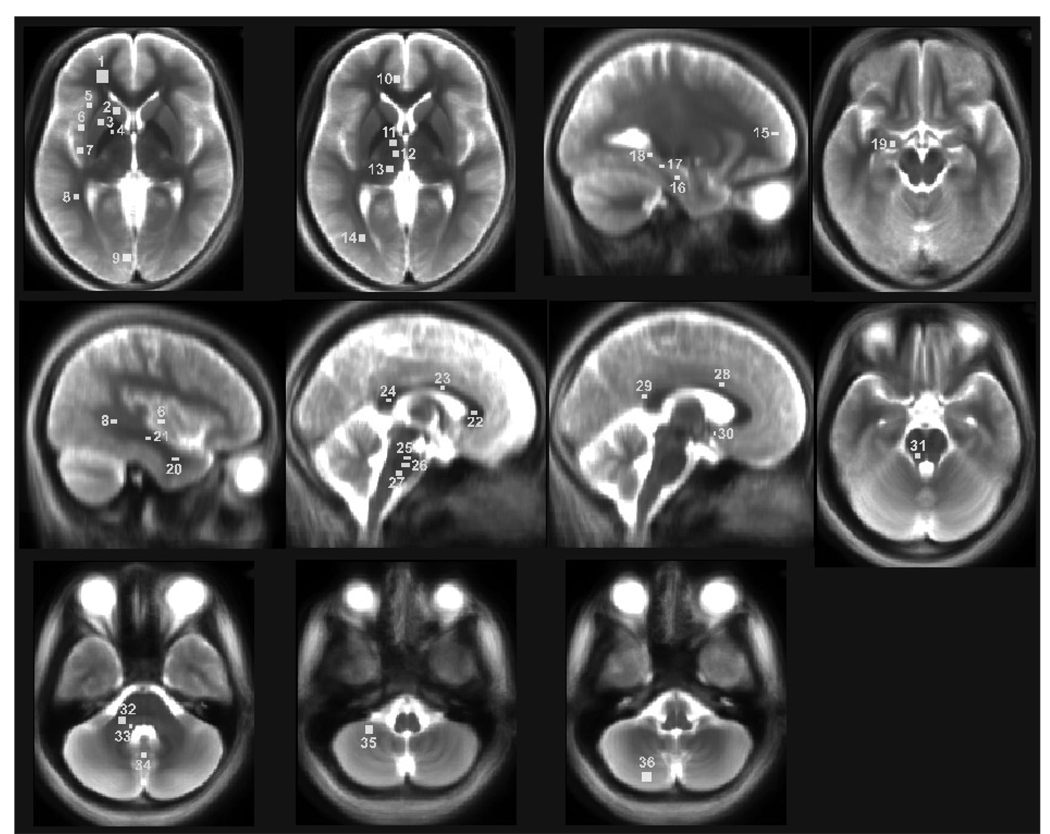
Figure 1.
Brain regions showing regions of interest (ROIs) on mean background images, with ROIs represented by rectangles proportional to volumes collected and used for T2-relaxation calculations. ROIs are overlaid onto mean background images, derived from normalized T2-weighted images; for clarity, only left-sided ROIs are displayed. 1, frontal white matter; 2, caudate nucleus; 3, putamen; 4, globus pallidus; 5, anterior insula; 6, mid insula; 7, posterior insula; 8, superior temporal white matter; 9, midline occipital gray matter; 10, anterior cingulate; 11, anterior thalamus; 12, mid thalamus; 13, posterior thalamus; 14, occipital white matter; 15, frontal cortex; 16, inferior hippocampus; 17, mid hippocampus; 18, superior hippocampus; 19, amygdala; 20, inferior temporal white matter; 21, mid temporal white matter; 22, anterior corpus callosum; 23, mid corpus callosum; 24, posterior corpus callosum; 25, superior pons; 26, mid pons; 27, inferior pons; 28, mid cingulate; 29, posterior cingulate; 30, hypothalamus; 31, superior cerebellar peduncle; 32, mid cerebellar peduncle; 33, inferior cerebellar peduncle; 34 cerebellar deep nuclei; 35, rostral cerebellar cortex; 36, caudal cerebellar cortex.

